
Monnit Edge - 01 Node-RED basics
Node-RED basics
Official docs (bookmark these):
- Getting started: https://nodered.org/docs/getting-started/
- Using the editor: https://nodered.org/docs/user-guide/editor/
- Working with messages: https://nodered.org/docs/user-guide/messages
- Full docs home: https://nodered.org/docs/
1. What Node-RED is
Node-RED is a flow editor. You connect boxes (nodes) with lines (wires).
Messages travel left → right along wires when the flow is Deployed.
A tab (top of the canvas: 00, 01, 02…) is one page of a flow.

2. Parts of the screen (every item)
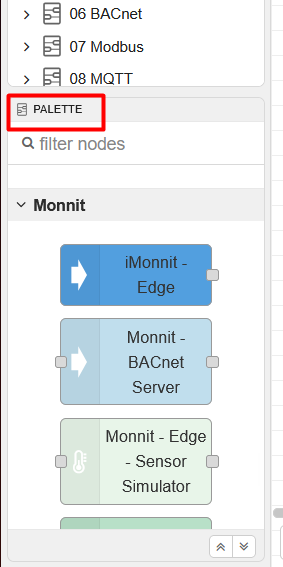
Left — Palette
- Lists every node type you can add (common, network, Monnit, …)
- Search box at the top: type a name (e.g.
debug,inject) - Drag a node onto the canvas to add it
-
Categories can be collapsed/expanded
Center — Canvas (workspace)
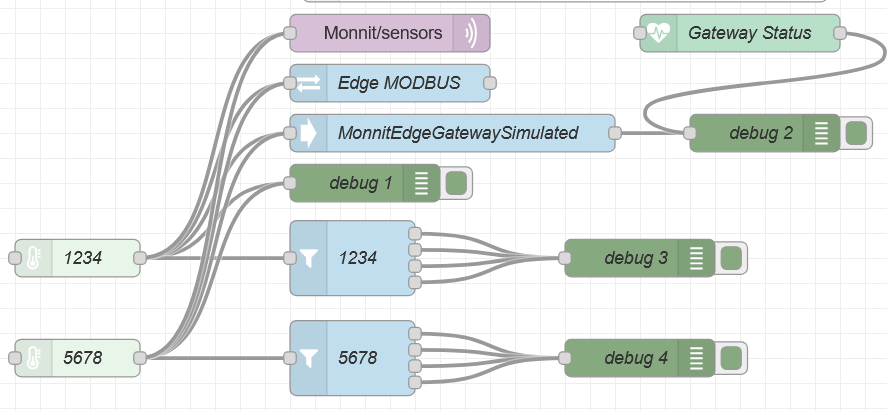
- Where your flow lives
- Pan: click empty space and drag, or use scrollbars
- Zoom: browser zoom or editor zoom controls (if shown)
- Select: click a node (it highlights)
- Move: drag a selected node
- Wire: drag from the small circle on the right of a node to the circle on the left of another
- Delete wire: click the wire, press Delete
- Delete node: select it, press Delete
-
Tabs along the top switch between flow pages
Top bar
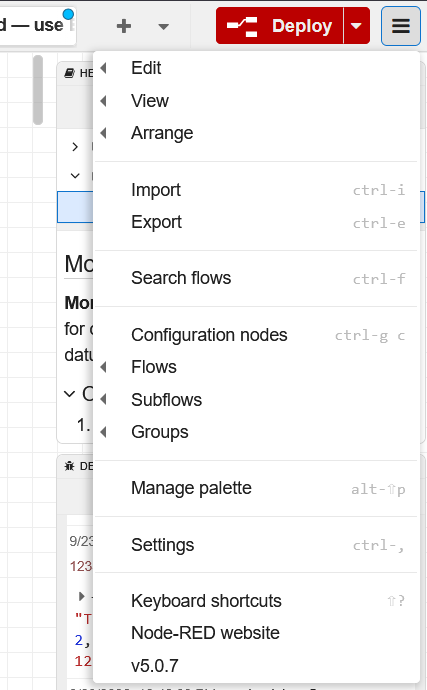
- menu (☰): Import / Export / Search flows / Settings / Keyboard shortcuts
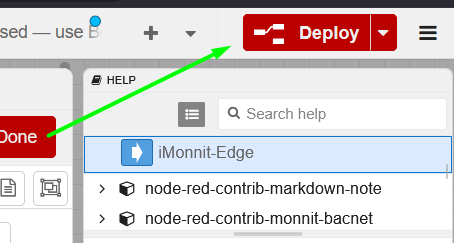
- Deploy (red button): applies your changes — nothing new runs until you Deploy
-
Deploy options (dropdown on the button): usually Full is fine for this lab
Right sidebar — panels (click the icons)
| Icon / panel | What it is for |
|---|---|
| info | Help text for the selected node (read this when stuck) |
| help | Longer documentation for that node type |
| debug | Live messages from debug nodes (most important for testing) |
| config | Shared config nodes (brokers, BACnet networks, …) |

If the sidebar is hidden, use the tabs/icons on the far right edge to open it.
3. Nodes, wires, and messages
| Term | Meaning |
|---|---|
| Node | One step (inject, debug, BACnet, …) |
| Wire | Path a message takes between nodes |
Message (msg ) |
A JavaScript object; almost always has msg.payload |
msg.topic |
Optional string label (often a sensor id) |
| Status | Text under a node after Deploy (green/yellow/red hints) |
| Config node | Shared settings opened via a pencil icon inside a node dialog |
4. How to configure a node (every time)
- Double-click the node on the canvas
- A dialog opens with that node’s settings
- Change fields (dropdowns, checkboxes, text)
- Click Done (saves into the editor, not yet live)
- Click Deploy (makes it live on the Edge)
Pencil icon next to a field (Network, Broker, …) opens a config node — ports, passwords, device IDs. Edit those carefully, then Update → Done → Deploy.
Cancel discards dialog changes. Delete in the dialog removes the node.

5. Deploy — why it matters
- Edits on the canvas are drafts until Deploy
- After Deploy, heartbeats start, listeners bind ports, MQTT connects
- If something “does nothing,” you usually forgot Deploy
-
A successful Deploy shows a short confirmation; errors appear in notifications / log
6. Debug — how to see data (detail)
Add / use a debug node
- Palette → common → debug (or use the one on this tab)
- Wire any node’s output → debug input
- Double-click the debug node:
| Setting | What to choose |
|---|---|
| Output | msg.payload = only the payload; complete message object = everything (payload , topic , …) |
| to sidebar | checked — show in the Debug panel |
| to console | optional — also prints in the Node-RED log |
| Name | optional label so you know which debug fired |
- Done → Deploy
Open the Debug panel
- Right sidebar → click the bug icon (debug)
- New messages appear as they flow (newest at the bottom or top depending on version)
- Click a message to expand objects/arrays
- Use the Debug panel toolbar to:
- Clear old messages
- Filter (all nodes vs current flow) — if you see nothing, set filter to all or open the correct tab
- Pause/open as needed
What “good” looks like
- After you click Click me below, Debug shows one string message
-
Later tabs: Debug shows sensor objects with
sensorId/readings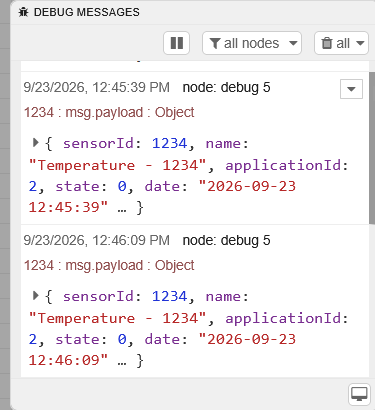
Debug shows nothing?
- Did you Deploy?
- Is the debug node wired from something that actually sends?
- Is to sidebar enabled on the debug node?
- Is the Debug panel filter hiding this flow?
- Is the upstream node stopped/error (red status)?
7. Practice
- Click Deploy
- Click the small square on the left of Click me (that button fires one message)
- Open Debug on the right — read the text
- Double-click Click me — change the payload text → Done → Deploy → click again
- Double-click Debug sidebar — switch Output to complete message object → Done → Deploy → click inject again → expand the message in Debug
When that feels comfortable, open tab 02 Path.
8. Official help
More depth, screenshots, and keyboard shortcuts:
https://nodered.org/docs/getting-started/
https://nodered.org/docs/user-guide/editor/
https://nodered.org/docs/user-guide/messages