Advanced Vibration Meter Configuration and Installation Guide
Overview
The ALTA® Wireless Advanced Vibration Meter (AVM) includes an accelerometer within a sealed cube at the end of its lead that attaches to a surface. By the end of each user-defined report interval, or Heartbeat, the Advanced Vibration Meter collects at least one measurement of 64 to 128 acceleration samples to generate a report. If there is significant energy in the lower band of the first 64-point measurement, a second 64-point measurement will be taken at a lower sample rate to measure low frequencies within the band better. The report details the measured vibration through data about each of the three orthogonal axes (x,y,z):
- Vibration—Peak acceleration in the time domain, root mean square (RMS) acceleration, RMS velocity, or peak-to-peak displacement
- Frequency—The frequency with the most vibration energy in the band range in Hz or RPMs
- Crest Factor—The ratio of peak acceleration over the RMS acceleration—indicates whether non-fundamental vibrations could damage a machine with a mechanically coupled surface. Or whether the surface experiences greater accelerations than the sensor is configured to measure.
The Advanced Vibration Meter also reports the Duty Cycle—the percentage of the time, during the reported interval, when vibration is above the Sensitivity Threshold—and the temperature of the electronics within the cube.
Features
• Three-axis measurement
• Configurable Vibration Measurement modes to report Peak Acceleration, RMS acceleration, RMS Velocity, or Peak-to-Peak Displacement
• Configurable Frequency Range
• Configurable Hanning filter
• Measure vibration frequencies up to 4200 Hz / 252,000 RPM
• Configurable Measurement Interval as low as one second
• Configurable critical Vibration Aware Threshold
• Runtime indication via Duty Cycle
• Three configurable Data Report modes (Most Recent, Average, Max)
Settings to Configure
● Vibration Mode—Option to select what information the meter will generate: Velocity RMS, Acceleration RMS, Acceleration Peak, or Displacement Peak-to-Peak.
● Vibration Aware Threshold—Vibration level when the device will immediately report and enter its Aware State.
● Vibration Hysteresis—A buffer to prevent the sensor from bouncing between Standard and Aware States when the vibrations are very close to a threshold.
● Vibration Sensitivity Threshold—Measured values below this limit are ignored and will not count toward the Duty Cycle. Setting this to 0 will force the sensor to analyze every measurement (including noise) thoroughly, and the Duty Cycle will always be 100 percent. Vibration values below this threshold will be reported as 0.
● Window Function—Determines which filter to apply to the FFT results. Rectangular means no filtering. Hanning minimizes spectral leakage and is highly recommended for displacement measurements.
● Accelerometer Range—Determines the accelerometer’s maximum observable g-force. If the actual measured values are above this setting, the peaks of the vibration waveform may be clipped, distorting the data and typically resulting in a Crest Factor below 1.41.
● Measurement Interval—The seconds between vibration measurements. Each vibration measurement consists of 64 to 128 acceleration samples collected at the configured Sample Rate to calculate the vibration data and duty cycle. Temperature data is also measured, but only one sample is taken during the measurement interval.
● Sample Rate—Determines the digital sampling frequency of the accelerometer.
● Frequency Range Minimum—Vibration below this limit is filtered/ignored and may be set as low as Sample Rate / 256.
● Frequency Range Maximum—Vibration above this limit is filtered/ignored and may be set as high as Sample Rate / 2.
● Power Mode—Control the power consumption and noise of the accelerometer during measurements by changing the amount of oversampling performed. Low Power averages one reading per sample. Medium Power averages 16 readings per sample. High Performance averages up to 128 readings per sample and consumes the most power. As readings per sample decrease, the inherent noise of the sensor also increases. So, as power consumption increases, noise decreases. At and above 800 Hz, all measurements are High Performance by default, regardless of this setting.
● Data Mode—Determines what data to display on each Heartbeat. Most Recent (Last data point measured before the data is transmitted), Average (Average of vibration data over the Heartbeat, the temperature is not averaged), and Maximum (Maximum vibration data measured over the Heartbeat, the temperature is the temperature measured when the max vibration data was gathered).
Additional Feature or Option
● Scale—Permits viewing the meter’s frequency data in Hertz or RPM.
Installation Recommendations
Mount the Meter Base
The meter base (housing the radio and microcontroller) features mounting flanges and can be attached to most surfaces using the two included mounting screws or double-sided tape.
- For a wooden, a metallic surface, or a dry-wall surface, you can use the double-sided tape (use two pieces) or the screws.
- For masonry, use the included double-sided tape. If the screws aren’t available, use two #7, 7/16” (0.4375”) screws.
- If the included double-sided tape isn’t available, use one or more pre-cut, double-sided foam squares of dimensions 1/32” x 3/4” x 3/4” from ULINE as model number S-11695 or similar.
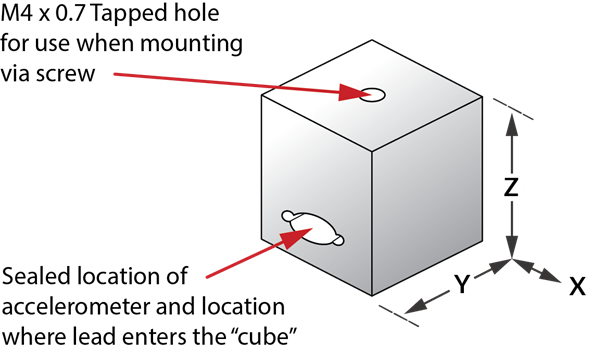
Mount the Accelerometer Cube
The leaded cube can be adhered to surfaces using a threaded stud, adhesives, double-sided tape, magnetic base, or a combination of all three. It is critically important that the cube is rigidly mounted to the system you wish to assess to ensure the sensor can accurately read the vibrations in the system.
Loose or non-rigid mounting can result in signal loss, unpredictable resonant frequencies, and less accurate results. The cube includes an axis indicator label to aid installation and improve the physical understanding of data reported to iMonnit.
Mounting Approaches: a through d below indicate typical mounting approaches and the generalized best-case frequency response associated with that mounting style.*

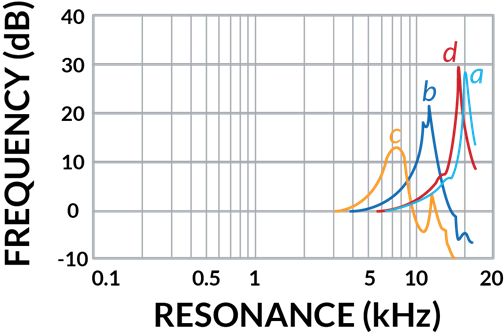
*Monnit doesn’t provide material for any of these mounting options. It is up to the installer to source appropriate mounting materials.
Things to Avoid: The graphic below indicates some things to avoid when mounting the cube.

Using the Meter
Review the data the meter can produce in its data sheet. Also, review the configurable features above and determine the measurement requirements of your use case or application before deciding on the final standard configurations for the meter. Vibration analysis can be highly complex; sometimes, an expert may be required to optimize this meter for a specific application in the best way possible. With that being said, this meter has many valuable features that can be employed without needing expert guidance. We recommend researching the system to be measured and reviewing the meter’s technical documentation.
Determining the Baseline
One of the most critical steps before setting final configurations on this meter is gathering baseline readings. A baseline is a set of average readings the sensor measures while the machine, equipment, or system is in a known good working state. Before determining this baseline, assessing your system’s typical operating frequency(or RPMs) is important. If this needs to be clarified from the system’s technical literature, this can be determined experimentally with the meter.
Find the typical operating frequency experimentally:
- Set the Vibration Mode to Acceleration RMS, Power Mode to High Performance, and Accelerometer Range to 16 G.
- Set the Sample Rate and the Frequency Range Min/Max settings on the meter, considering what you think the system’s operating frequency might be (where the assumed operating frequency falls just below the middle of the Frequency Range settings).
- Observe the readings of the sensor while the system is running. It’s best to gather several readings for a more robust picture of the typical operating frequency.
- Adjust the Sample Rate up and down and repeat Step 3, looking for what frequency produces the greatest Acceleration RMS readings. Note: Setting the Data Mode to Maximum and Measurement Interval to about 10x less than the Heartbeat can help speed up this process.
- Once you determine what frequency produces the greatest Acceleration RMS readings, you have found the typical or fundamental operating frequency.
Now, adjust the Sample Rate so the typical operating frequency falls within the lower third of the Frequency Range. This is desirable since harmonics (multiples of the typical operating frequency) may appear when system health degrades. The typical frequency in the lower third leaves better bandwidth at the upper end of the Frequency Range to see harmonics as they arise.
With an appropriate frequency setting found, all that is left is determining the preferred Vibration Mode. The Frequency Range of interest typically determines the ideal mode.
Select a Vibration Mode:
- Acceleration: Best for higher frequencies where frequencies of interest are above 1 KHz (60,000 RPM).
- Velocity: Best for medium frequencies where frequencies of interest fall between 10 Hz and 1 KHz (600 RPM to 60000RPM).
- Displacement: Best for low frequencies where frequencies of interest fall below 20 Hz (1200 RPM).
Using the Baseline
You can now determine the baseline with Vibration Mode and Frequency settings applied. Take an appropriate number of measurements while the system runs and use a combination of Average and Maximum Data modes to determine the baseline.
Things to Consider
If you wish to measure using multiple modes and frequency ranges simultaneously, multiple meters can be installed in or on a single system. The only real limiting factor here is the surface area available for mounting.
Direct Analysis
If you’re looking for a specific vibration or several aspects of the system, the meter’s settings can be changed at any time to help assess different vibration measurements. This may involve changing settings several times within an hour to get more refined measurements. The beauty of Monnit Remote Monitoring Solutions is that setting changes and related analysis can be conducted anywhere you have Internet access, saving significant time and travel expenses.
Managing Noise
Noise inherent to the meter is influenced significantly by the sample rate and power mode. If you wish to reduce noise or filter readings that are most likely caused by noise, try the following (In order of most effective to least effective):
- Set power mode to High Performance.
- Reduce the Sample Rate if feasible.
- Increase the Sensitivity Threshold.
- Shrink the Frequency Range to remove unnecessary signal frequencies for the application.
- Set Data Mode to Average readings across the Heartbeat.
Troubleshooting
|
Symptoms |
Detailed Problem Description |
Solution |
|
Hardware Error is Reported in iMonnit |
The sensor base can’t communicate with the measurement circuitry in the cube. STS is set to 8 or 9. |
If this condition occurs all the time, try setting default configurations. If a hardware error occurs occasionally, try routing the cable away from significant noise-producing items (heavy machinery, high-current power cables, transformers, etc.). If the problem persists, contact Monnit technical support for further guidance. Persistent hardware errors not addressable by the above directions usually require repair by a technician. |
|
Unexpected Vibration Readings |
Vibration levels do not appear to be accurate. |
1. Verify the cube is rigidly mounted to the system to ensure the cube moves precisely as the system moves. Refer to the Mounting guide section of this document for additional mounting instructions. 2. Verify the meter’s configurations in iMonnit align with your application requirements. For more configuration information, refer to this guide’s Settings to Configure section. 3. The sensor can produce readings from electronic and environmental noise. To filter this noise, increase the ST. 4. Refer to the data sheet for a detailed description of how each data point is generated to understand better how the measurements are produced and verify this aligns with your application. 5. Refer to the data sheet for vibration and frequency specifications to determine if the meter is reading within expected tolerances. |
|
Unexpected Crest Factor (CF) Readings |
Crest Factor readings are below 1.41 or much higher than expected. |
1. CF readings can be below 1.41 if the Accelerometer Range setting is lower than the vibration signal. The value is lower than 1.41 due to the clipping of the signal. Address this by increasing the Accelerometer G-Range in Settings. 2. If the meter is experiencing high noise levels, then it is very likely that the CF level will be relatively high (2.5+). If there is noise, the high CF is usually accompanied by lower, inconsistent vibration readings. This behavior is normal. If desired, increasing the Sensitivity Threshold will filter out these low-level readings. 3. If there are harmonics, the CF will usually be accompanied by consistent normal or higher-than-normal vibration readings. In this case, it may indicate poor machine health, not a meter problem. System inspection by a technical expert is recommended at this time. |
|
Duty Cycle is Always 0 or 100% |
Duty Cycle always reports 0 or 100% |
1. If the Duty Cycle is always 0%, the Vibration Sensitivity Level (VST) is probably too high. 2. If the Duty Cycle is always 100%, the VST is probably too low or 0. |